This infographic from Blogmost offers numerous ways to share content through social media - way beyond just Google Plus, Facebook, and Twitter. But this infographic implies a key difference between content marketing and SEO strategy.
SEO, to a certain extend, is about directing content to various platforms, sometimes with a message that includes an offer or reference to your business, product, or service. Content marketing also includes curation of other media, all for the purpose of being helpful to your potential customers. Thus an offer or reference to your business, product, or service is not included.
That difference should be kept in mind as your business develops content to be offered on the platforms listed below.
In the meantime, enjoy the infographic!

Sometimes e-commerce reporting in analytic solutions can be intimidating place to start. An e-Commerce business or an organization with an e-Commerce group faces many reports combined with many products for a visitor to view. So on first blush, considering what details to manage at first seems confusing.
To develop analytic reporting, consider these activities to build best reporting practices.
Monitor speed to purchase
Visits to purchase and days to purchase are valuable metrics in determining how quickly purchases are being conducted. This is a different perspective than the standard goals and recency reports shown in Google Analytics. Goals usually reflect the current within a visit clicking on a button playing a video for reaching for page referred time on the website. Multiple actions are typical for e-commerce site, given the number of items made available. Thus E-commerce goals differ by representing both a conversion in a visit or actions with a visit.
Match analytic reporting to territory to better track sales by currency
It is best to have a profile for each country in which you intend to operate. The reason is currency differences. Most analytic solutions have no means to combine currencies within one profile. So to make retail reporting easier, establish an analytic profile that contains data for local websites serving a specific region.
Watch for discrepancies in the visitor data
Some decay in data can occur as traffic is examined from a click of a tagged form to a conversion goal. This error is usually represented as a difference between visits and orders forfilled. The error comes about due to tracking concerns. Browser settings, blocked cookies, and multiple clicks within a visit increases the likelihood of an error count. Users can use Charles or Fiddler to confirm that there are no consistent client-server issues with the website that could be causing the error. Errors over 10% are a concern worth seeing a correction.
Check the item details that go into the E-commerce Javascript tag
Details such as SKU codes are usually required in the Javascript tag. These details are necessary for the E-commerce analytics reports to capture metrics and data. Make a list of what should be included
Check Javascript syntax where possible
Another area to check in the syntax used in the Javascript tag. Watch for unique symbols that do not work well in a Javascript syntax, such as currency symbols. Sometimes a symbol is not interpreted in the script well, causing a misfire of a code.
To make an inspection easier, set a master profile where unfiltered data can be examined. This can provide a check for setting changes and help validate proper code. A web developer can verify and dig into the code details for errors or possible mismatch within the Javascript syntax.
Maintain a roll up account
Just as with filters, where maintaining an "unfiltered" account is important, E-commerce should maintain a roll up account that covers all related e-commerce reporting. This is particularly useful when purchases are handled through various territories and there needs to reporting unfiltered to detect reporting and in some cases diagnostic concerns.
Some businesses install two or more analytics tools - it is possible to have a Google Analytics tool with Piwik or Woopra on the same site. Or have Adobe Analytics and Google Analytics on the same page. Many large organizations run both Adobe and Google - usually with Google at the onset of an analytics project, with Adobe considered for its ability to manage complex campaigns. Or WebTrends or Google Premium.... I think you get the point.
But not every result from a measurement tool will be exactly the same. The number count on Piwik may differ from that of a Google Analytics reports.
So what is the benefit of having dual tools on a site? The best answer lies in comparing data for general trends that appear on both tool. Given the same referral traffic and online conditions, a general increase in one can be similar in another. That can be useful to vet if conditions, such as a campaign effect, are indeed an influence on a result.
In this instance you are comparing precision across measurement tools. Precision in scientific terms is about repeatability - how well your results can be duplicated.
This perspective differs from that for accuracy. Accuracy is defined as a quality or state of being correct or precise; nearness to what should be in place. Given that there may be subtle differences in how solutions measure, you will have a difficult time reconciling different numbers. High data volume and data imperfection impair accuracy. Analytic solutions are not all the same, so there an be some accuracy discrepancy between solutions. How one measures the sources for a bounce rate may be different from another. You or your team can even waste time examining why a difference exists within a given time period between two solutions. Indeed using one solution can eliminate confusing decisions about trends in a set of data. It is ultimately the ideal arrangement for an analytic solution.
But for instances in direction regarding data accuracy,multiple solutions on a site can have a beneficial diagnostic effect for organizing potential reporting issues.
Justin Cutroni, Google Analytics evangelist, once said that there’s more to analytics than just adding a tag to a webpage (very true!). For many analytics practioners, that “more” comes in the form of quality assurance or QA tools. These tools are extension of various web development tools, used to confirm functionality of a tag as well as the website after a tag is installed, as well as other function checks at the browser.
Many analytics solutions have some level of diagnostic, but again, these are meant for once the analytics is in place, and are more about client side issues. Not all reporting covers server side issue, which can affect analytic performance as well.
Tag assistant is a Chrome plugin in that verifies Google Tag Manager and Google Analytics tags, as well as a few other enterprise-level Google advertising services in which a tag is used. The assistant provides a drop down menu when prompt that leads to a Google webpage with a list of diagnostic suggestions. There is also a Google Plus community that supports the tag assistant plugin with questions and answers.
Another Chrome plugin is GA Debugger. This plugin sends debug information to the Javascript console, a screen that appears alongside a webpage. The console is meant to show webpage elements while on-page, permitting developers to understand what is in the code.
Among the most well known tool among web analytic practitioners is a Google Analytics specific tool called WASP. Developed by Stephane Hamel, WASP also debugs code. There is a crawler functionality, meaning the debugger can crawls a site for issues. There is a plugin version which runs in the Chrome browser (and also works from within the Javascript console).
The point of each of these tools is to help audit issues that affect how a page loads in a browser. Minimizing problems at the browser can maximize visitor engagement at the website.
Developing an interest in Pinterest is leading to significant gains for retailers and small businesses.
Image search is raising product attention among customers. Pinterest Analytics, along with redesigns in other social media platforms, spotlights the importance to the bottom line.
Online search has been popular for several years now. But search quality is beginning to spread into different digital media. Among these splinter search techniques, image search is increasingly becoming as desirable to digital marketers as Manhattan real estate to a New York City realtor.
A number of technological and usage factors in digital marketing is the cause for the growing interest. New technical features in code and programming languages are discovering new ways to highlight media files. HTML5, for example, introduced new tags such as <video> and <figure> to distinguish media elements in the browser. Such distinctions are an aid as search engine algorithms increase their query sophistication.
Another factor lies in the devices being used while online. Digital images have always been available, but now smartphones and new behavior introduced by social media has made image share essential. Digital Trends reported that 27% of US smartphone users share photos through their device. Facebook, the largest photo-sharing website in the world, sees 300 million photo uploads daily.
Raising the ante to bridge consumer activity to measuring insights is Pinterest Analytics. The new measurement solution provides pinning diagnostics – number of pins in a given period, where pin clicks lead, impressions, and the means to determine overall pin performance. Its launch is the first in-house solution from Pinterest. A third party solution, Reachli, has been available for a year.
The introduction of Pinterest analytics means more than keeping up with Facebook Insights or the analytics centered on Twitter. Pinterest has generated a highly engaged community of followers, qualities that has benefited participating retailers and attracting marketers. The skew towards women has been documented for some time. In 2012 Marketing Land noted a Nielsen report heralding the platform’s high growth rate, a 1,047% increase in unique PC visitors. Reuters reports Pinterest to have 48 million users worldwide.
Most of all, the Pinterest activity implies the value images have for customers as they research retail goods. Retailers will want to pay attention to images, their labels, and descriptions, which lead to customer discovery. An image with a primary keyword in its file name and description, for example, can show in a search engine result page.
Evaluating and refining on-page image element descriptions will help marketers gauge the right images that can endear customers to their brand. Further sophistication in analytics will aid marketers in discovering how well a keyword or phrase attracts people to a digital presence. Search context will begin to include a more visual meaning. The ultimate potential can lead to a blend of image sharing campaigns on social media with on-page image element descriptions that complement search optimization techniques.
The jury regarding the best co-existing strategies of social media and organic search is still deliberating. But as search engines improve their reference of social media reference and website incorporate more semantic tagging descriptions, images used for entice researching customers will provide the context needed to make organic search even more beneficial for the customer.
When it comes to building a digital presence, one of the most overlooked activities businesses make is to not optimize their website layout. Reviewing a wireframe makes such a review possible.
A wireframe is basically a sketch of website hierarchy. To envision it, think of a NCAA basketball tourney bracket, or any other sports bracket for that matter. Now imagine that bracket cut in half and turned north-south like a pyramid. That’s basically similar to what a wireframe layout should be – a bracket of pages that indicates how they are related. To make your wireframe effective, think of each of your webpages in each slot of the tourney brackets, like the image below. The connections are meant to reflect how a website visitor is meant to navigate from page to page.
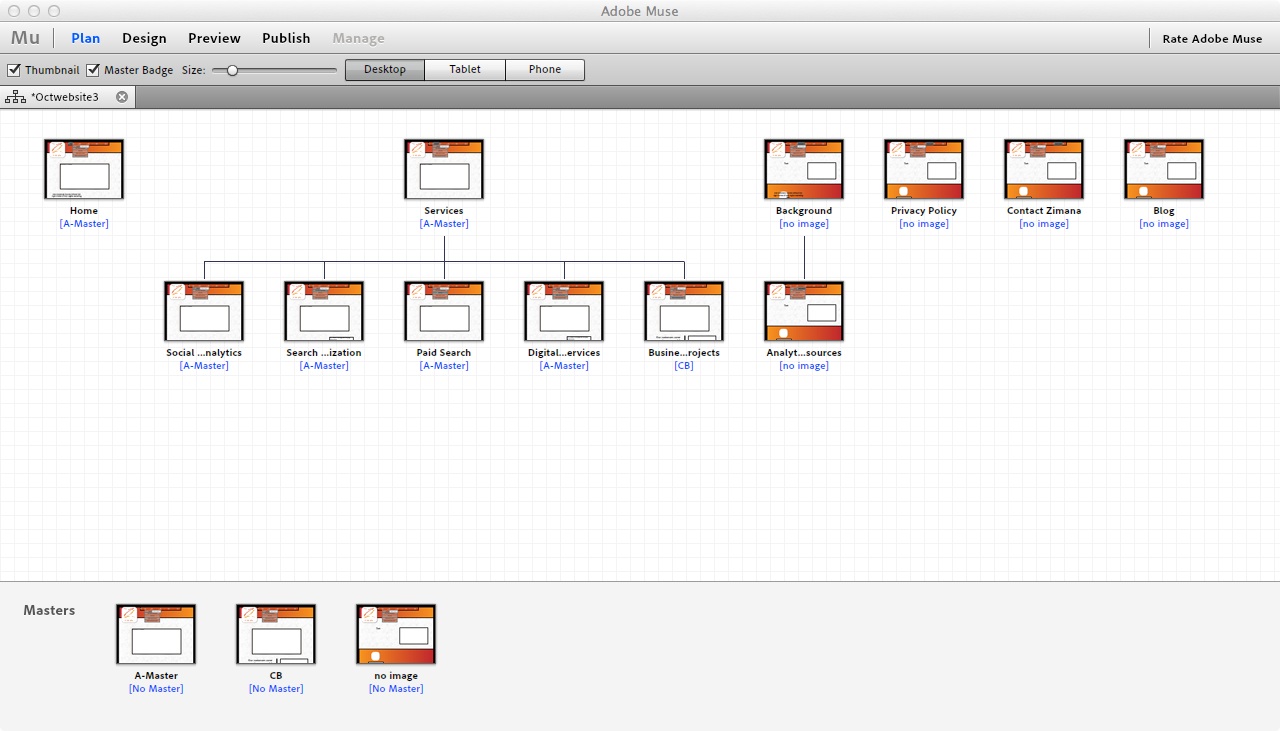
This matrix in Adobe Muse is not a wireframe, but does show how pages are connected in a website. This overview can aid discussion about navigation and other wireframe concerns.
Consider the following criteria for website elements, based on a Website Magazine article "Getting Wilde With Wireframes". These criteria determine how a page layout best addresses the overall website experience:
Examining these criteria leads into discussion about inserting analytic tags - the labeling of players, buttons, and other website sections as a conversion action. Event tracking was explained in this early Zimana post. Since that time, web apps and updated websites have invented new event tracking usages to understand how visitors will interact with website or app elements.
In a past Zimana post on event tracking, the Javascript protocol was added as a script to a website button. When Google introduced its tag manager, accessing the code and control for event tracking was moved from the page to a user interface. The benefit was no longer having to manually add the event tracking code to a page.
Google Analytics evangelist Justin Cutroni once explained a great usage for event tracking - he notes how event tracking can be triggered as a website visitor scrolls down to certain page segments. This technique can be useful for vertical parallax website design, revealing how content is consumed in analytics reports.
Reviewing the tag concerns can bring forth a better identified purpose for the site, a better selection of supporting marketing, and be easier to install at a website's launch. It can also lead to early detection of potential website performance issues. For more on page load performance and other website development tips, check out these Zimana posts: