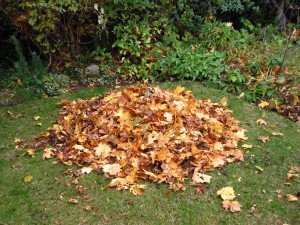
A heap of leaves comes from an accumulation of time...and raking. Javascript calls can act in a similar manner.
Frank Sinatra once sang about reaching the top of the heap. Certainly he was not thinking about Javascript at the time of his hallmark song - the personal computer let alone programming language was still years away from an introduction. But the longevity of success implied in the song can be analogous to how heaps work in JavaScript.
Heaps in JavaScript are long lived objects, the difference between objects created and deleted. Heaps appear when memory leaks occur. A memory leak is when an object in a program is still consuming memory assigned to it after the code has been read, and the object assessed. The overall significance is a degraded performance for an app.
JavaScript programs have a protocol to minimize memory leaks, but that protocol is not a 100% fail safe. A memory management protocol called garbage collection is meant to clear objects and variables from the memory associated with the DOM. But some JavaScript objects are unintentionally kept alive in the DOM, which can in turn keep other objects alive in the DOM. The challenge can occur particular with one-page apps, which are not usually refreshed. This means that heaps are created over time.
To detect heaps, start with a baseline sense of how scripts are loaded and executed in a website and app. Use a page load tool and measure the current average load time is.
Once with a baseline, take a look at development tools that examine memory management. These tools typically can take snapshots that reflect when memory leaks occurs as a script executes.
The results are shown as an annotated timeline in most tools, similar to the page load speed tests that are available. Examine performance under a continuous paint mode - doing this highlights how elements are being rendered.
Consider adjustments such as local scopes of variable, event listeners, manage local cache. After making adjustments, measure again to see if there is an improvement in the page load. Use a console tool to closely examine a sequence and trigger an element within the DOM.
Resources to verify Javascript Heaps
Consider looking at resources to discover other experts who can provide some insights to how to best test for heap. The hashtag #perfmatters on Twitter is a great source to share development insight and knowledge.
Another is
HTML5rocks.com. It is a general search engine resource, which can be used to find articles and tips on web performance issues related to heap and JavaScript.
jsperf.com is a technical resource, sharing test cases meant to compare the performance of different JavaScript scripts and segments.
Finally look at
jankfree.org, a resource site. Jankfree has resources centered on jank - a performance stutter that occurs when an app or site is not keeping up with a refresh rate of a device. There are segments, the most relevant to JavaScript Heap concern dedicated to Chrome DevTools ( which includes articles and a RunTime performance checklist). There are also sections dedicated to browser and layout issues (Touch and Input; Layout and Styles).