This look at Facebook Fans values indicates how segments need to match to your business. The airline in this video found some of its fans were outside of the customer demographic it serves.
The video dovetails into a growing trend of having more fans than value - such as fake followers purchased for Twitter and Facebook accounts. That trend also plays an influential factor in big data as social media comments and mentions are correlated to predictive models. How much data cleansing becomes required if your sources do not relate to characteristics of interest? This video will give some thought to it, at least from the perspective of a Facebook Fanpage.
Enjoy, and be sure to comment at All Analytics in the YouTube page as well as here on this blog.
Websites. Businesses need them. But there's an underlying fear when it comes to budgeting a cost for a website. .net Magazine, a terrific web design site based in the United Kingdom raise up the key concerns businesses have with with paying someone to code. Businesses fear:
However, software and programming code are difficult to cost estimate. They require development to put a given set of elements - images, written content, inputs such as a product order - into a functional order that can be read by a browser or within an app. Not understanding code makes an estimate harder to envision.
Moreover, there’s a prevailing attitude that code is static – that if I commit X,Y, and Z steps, my website will look like P,Q,and R. That’s not a precise great way of planning a site, even less so for apps.
When you get to the heart of the matter, programming code is a language. That means there are many styles, which means many ways to provide functionality. It also means many designers and developers can have “dialects” – different approaches to code which may affect the choices and how the relationship works.
So with these challenges, what should a small business owner understand to make better budgeting choices?
One Bonus Tip (added after this great list was created!)....
Be wary of making huge changes to site templates - Templates are still governed by code, so some changes beyond images and worded content would require reviewing the CSS files and HTML files, or other files necessary to construct your site. A template is meant for simple, quick changes, but may not be structured for a customer experience that benefits your business. Have a professional review if you have a myriad of changes. Even paying a developer an hour or two to review a site can save you time and effort on a DIY project.
We hear about APIs increasingly as apps and Saas increase their influence on a customer's digital experience. But what are the value of APIs? Let's look at some basics to learn how they can be best managed from an analytics or business intelligence perspective.
APIs are programming protocols. They are provided by the developer of a source app or software. Their purpose is to increase development based upon an application or software, allowing additional services. Twitter is a great example. From Tweetdeck to Vine, there a hundreds of applications that rely on the API access. APIs data can take a number of standard programming formats, such as JSON or XML. (The calls to API typically take SOAP or REST protocol)
So for a developing business, what should be considered when examining an API to be used.
1. What is in the library?
Knowing the protocol included in an API sounds basic, but its formats and protocols can indicate what development is possible for a dashboard. Can the delivered data be rendered in a Javascript code or compatible for a plugin? The answer can stimulate ideas for improving reporting elements in a dashboard and determining ongoing technical needs.
2. What can you do with the data in a controlled manner?
This questions extends the first into the programming specifics that underlies the API. For example, ask "What is the rate limit for pulling data?" Twitter notes 150 calls per hour. This limits "real-time" to a certain extent and forms the reporting quality and specifications that can take place. This question is a critical one if app development is involved; it can indicate what kinds of "mashups" that can be developed.
3. How is the life cycle of this API maintained?
Are there updates or support from the platform offering the API? Examine what development support is available. APIs should to be easy to understand and document so that your business understand what should be highlighted as well as how to adjust reporting over time.
Ultimately APIs extended web presence to be useful. But understanding the data involved can provide the right means to manage the data over time and make your business as productive as it can be.

Prince went back to basics with his song "Black Sweat". The same should be considered for paid search with the advent of Enhanced Campaigns and remarketing
A few years ago, Prince wrote a back to basics song called "Black Sweat", a short 3 minute jam with minimal instrumentation and Prince's signature sound. Its sound was reminiscent of another song "Sign O the Times" during his high profile years.
Paid search campaigns sometimes needs a back to basics approach, especially with changes afoot with SEO and if a campaign was unsuccessful. Renewal of paid search strategy is a part of marketing - a message can become stale over time. The volume of messages on the internet accelerates that staleness
Yet many small businesses still don't leverage paid search well. But with new enhanced campaign features introduced on Google and Bing ads, there is now capability to reach searching visitors through mobile devices. Those customers are usually ready to purchase, so the right ad can make the difference for a sale.
To get your customers dancing to your marketing tune, consider these back to basics in crafting a quality ad...

Knowing the score for your business is like knowing the score of your favorite team
Deciding on metric can be as multifaceted as deciding on a clothing to wear or choosing a movie. Fortunately the facets can be, well, less-multi with a few reminders of what the metric is for.
First consider what an analytic report essentially consists of - metrics and dimensions:
If these two ideas are difficult to visualize, think of a scoreboard. Now imagine your favorite team playing against a rival - college football, NFL, soccer, baseball,it does not matter. The dimensions always represents the teams you are interested in. Metrics are the "scores" for that team.
Questions to ask when choosing the metrics worth measuring:
1.Is the metric valuable for an operation?
Monitoring a lot of metrics can take time away from making decisions about the metrics in the first place. Know what the cost to measure and monitor a metric - would a change in that metric affect your business operation? The answer to that question will reveal if it's worth the time to measure.
2.Is the metric addressing an operational decision, like a paid search campaign, or is the metric a strategic decision to the brand?
This is a follow up question to ask after answering the first. Here's the significance behind the meaning of this question:
Either kind of decision can be encountered separately in reviewing analytics data. From a business perspective, both choices help to organize the actions needed. An operational choice usually requires an immediate attention, such as halting a paid search campaign. Others can be more about strategic, such as reviewing the sites from which referral traffic arrives from. Make sure to develop a todo list and see how the needs fits these two outlooks.
3. Does the metric exist in the analytic solutions being used?
This implies the need for another source of data, clearly. But the next thought behind that question is the administrative choices required to obtain outside data. An additional source like Quantcast can provide an additional tag where others may require a visualization tool such as Tableau to pull data in, or GA data grabber to pull Google Analytics data into a spreadsheet conveniently. To determine the importance, consider if the metrics addresses an operational need, and then if there are strategic decisions that are subsequent of choosing the outside metric.
One additional tip: If the metrics are based on API-sourced data examine how the API publisher provides support. Understanding what protocols are used and supported will help determine dashboards needs to monitor a metrics associated with an API.
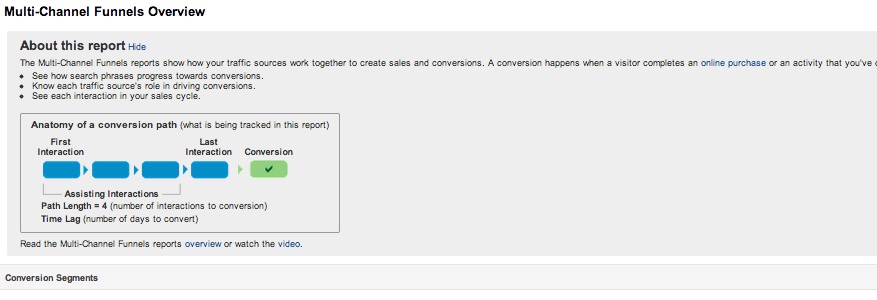
This Google Analytics feature for Multichannel Reporting shows the number of assists that can occur in a path. This kind of reporting can assist e-commerce sites in understanding how their digital marketing and social media is impacting their online sales (image: Google Analytics)
If you are wondering if your commerce sales are slowing down, maybe you should look at your website performance. The need for speed at the website has been rising, thanks to customers increasingly reviewing products, services, and recommendations through mobile devices.
The case for speed impacting costs has been made. Yottaa, a cloud provider of webpage optimization tools, discovered in its analysis that a 1 second delay in page load speed can lead to a 7% decline in conversion – that means lower sales online for digital retailers, lower leads for B2B firms that rely on white papers, or lower signups for event planners. A 1 second delay can also mean 16% lower customer satisfaction. And an analytics solution provider Adobe noted in its own survey that for a mobile layout, customers considered fast page speed as a high concern. A slow site correlates to problems in scaling a business for growth. So what should an online retailer do to monitor the speed in which people purchase online?
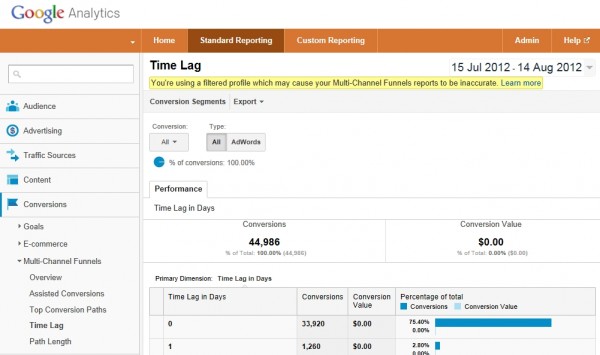
This time lag report can help your business keep an eye on the time require to convert sales. (Image Source: Search Engine Land)
Visits to purchase and days to purchase are valuable metrics in determining how quickly purchases are being conducted. This is a different perspective than the standard goals and recency reports shown in Google Analytics. Goals usually reflect the current within a visit clicking on a button playing a video for reaching for page referred time on the website. Multiple actions are typical for e-commerce site, given the number of items made available. Thus E-commerce goals differ by representing both a conversion in a visit or actions with a visit. Multichannel reports can also indicate how many visits occur before a purchase - segment grownups by purchase type to identify if one segment versus another is possibly taking a longer time to purchase.
Finally, plan a thorough review at mid year or at least once a year to understand how website visitors navigate through a website. Reviewing analytics reports based on visitor flow can imply where content may be better positioned. A/B testing and eye mapping solutions should be considered. No matter the analytics solution, you can check your dashboard so that it reveals the volume of business you receive online. So you can stay in business offline.