In the rush to learn big data, programming languages are becoming more central to solid analysis. The most popular so far has only one letter: R.
R is an open source language used for developing correlations. It is typically used with big data analysis on semi-structured data such as product reviews, images, and likes. It is powering the heart of statistics modeling, programming, and data visualization.
Because big data interest has skyrocketed, so has the interest and usage for R. A Data Informed article noted that in a survey data scientists 70% of those surveyed are using R alongside other programming languages. In fact some applications include R into their interface for more cohesive analysis.
For those professionals still learning, the good news is that there are several resources available for R programming. Here are a few resources for those who want to get acquainted with R:
R-bloggers: This blog covers a number of R programming concerns and related topics. The best aspect about the site is a community with varying aspects of the R programming language - Over 450 contributors offer their insights and best practice techniques. A job posting for R-related positions also appears on the site. Check out more at the R-bloggers site.
Deducer: Touted as an SPSS alternative, this open source interface is designed for professionals who do not have a full background in data science. The GUI is free to download at the Deducer site.
R-studio: Another free open source GUI available, R-studio is designed to make programming in R more user friendly and easier to edit.
Datacamp: Datacamp is similar to a number of online course sites - Udemy, Udacity, +Tuts - yet it focuses exclusively on data science. Datacamp provides free training on R as well as a general overview of what a data scientist is. Additional resources are also available at the Datacamp site.
Data Science Central is a great site that offers insights into current data concerns such as Hadoop and data visualization. The site offers a comprehensive summary of initial data analysis techniques using R in the page Summary of R via Data Science Central. Data for some to the explanations are also available via a zip file on the page.
Advanced R
There is an online book for more advance techniques called, strangely enough, Advanced R by Hudly Wickham. The site provides an overview of data structure and functional programming, with a special emphasis of package development.
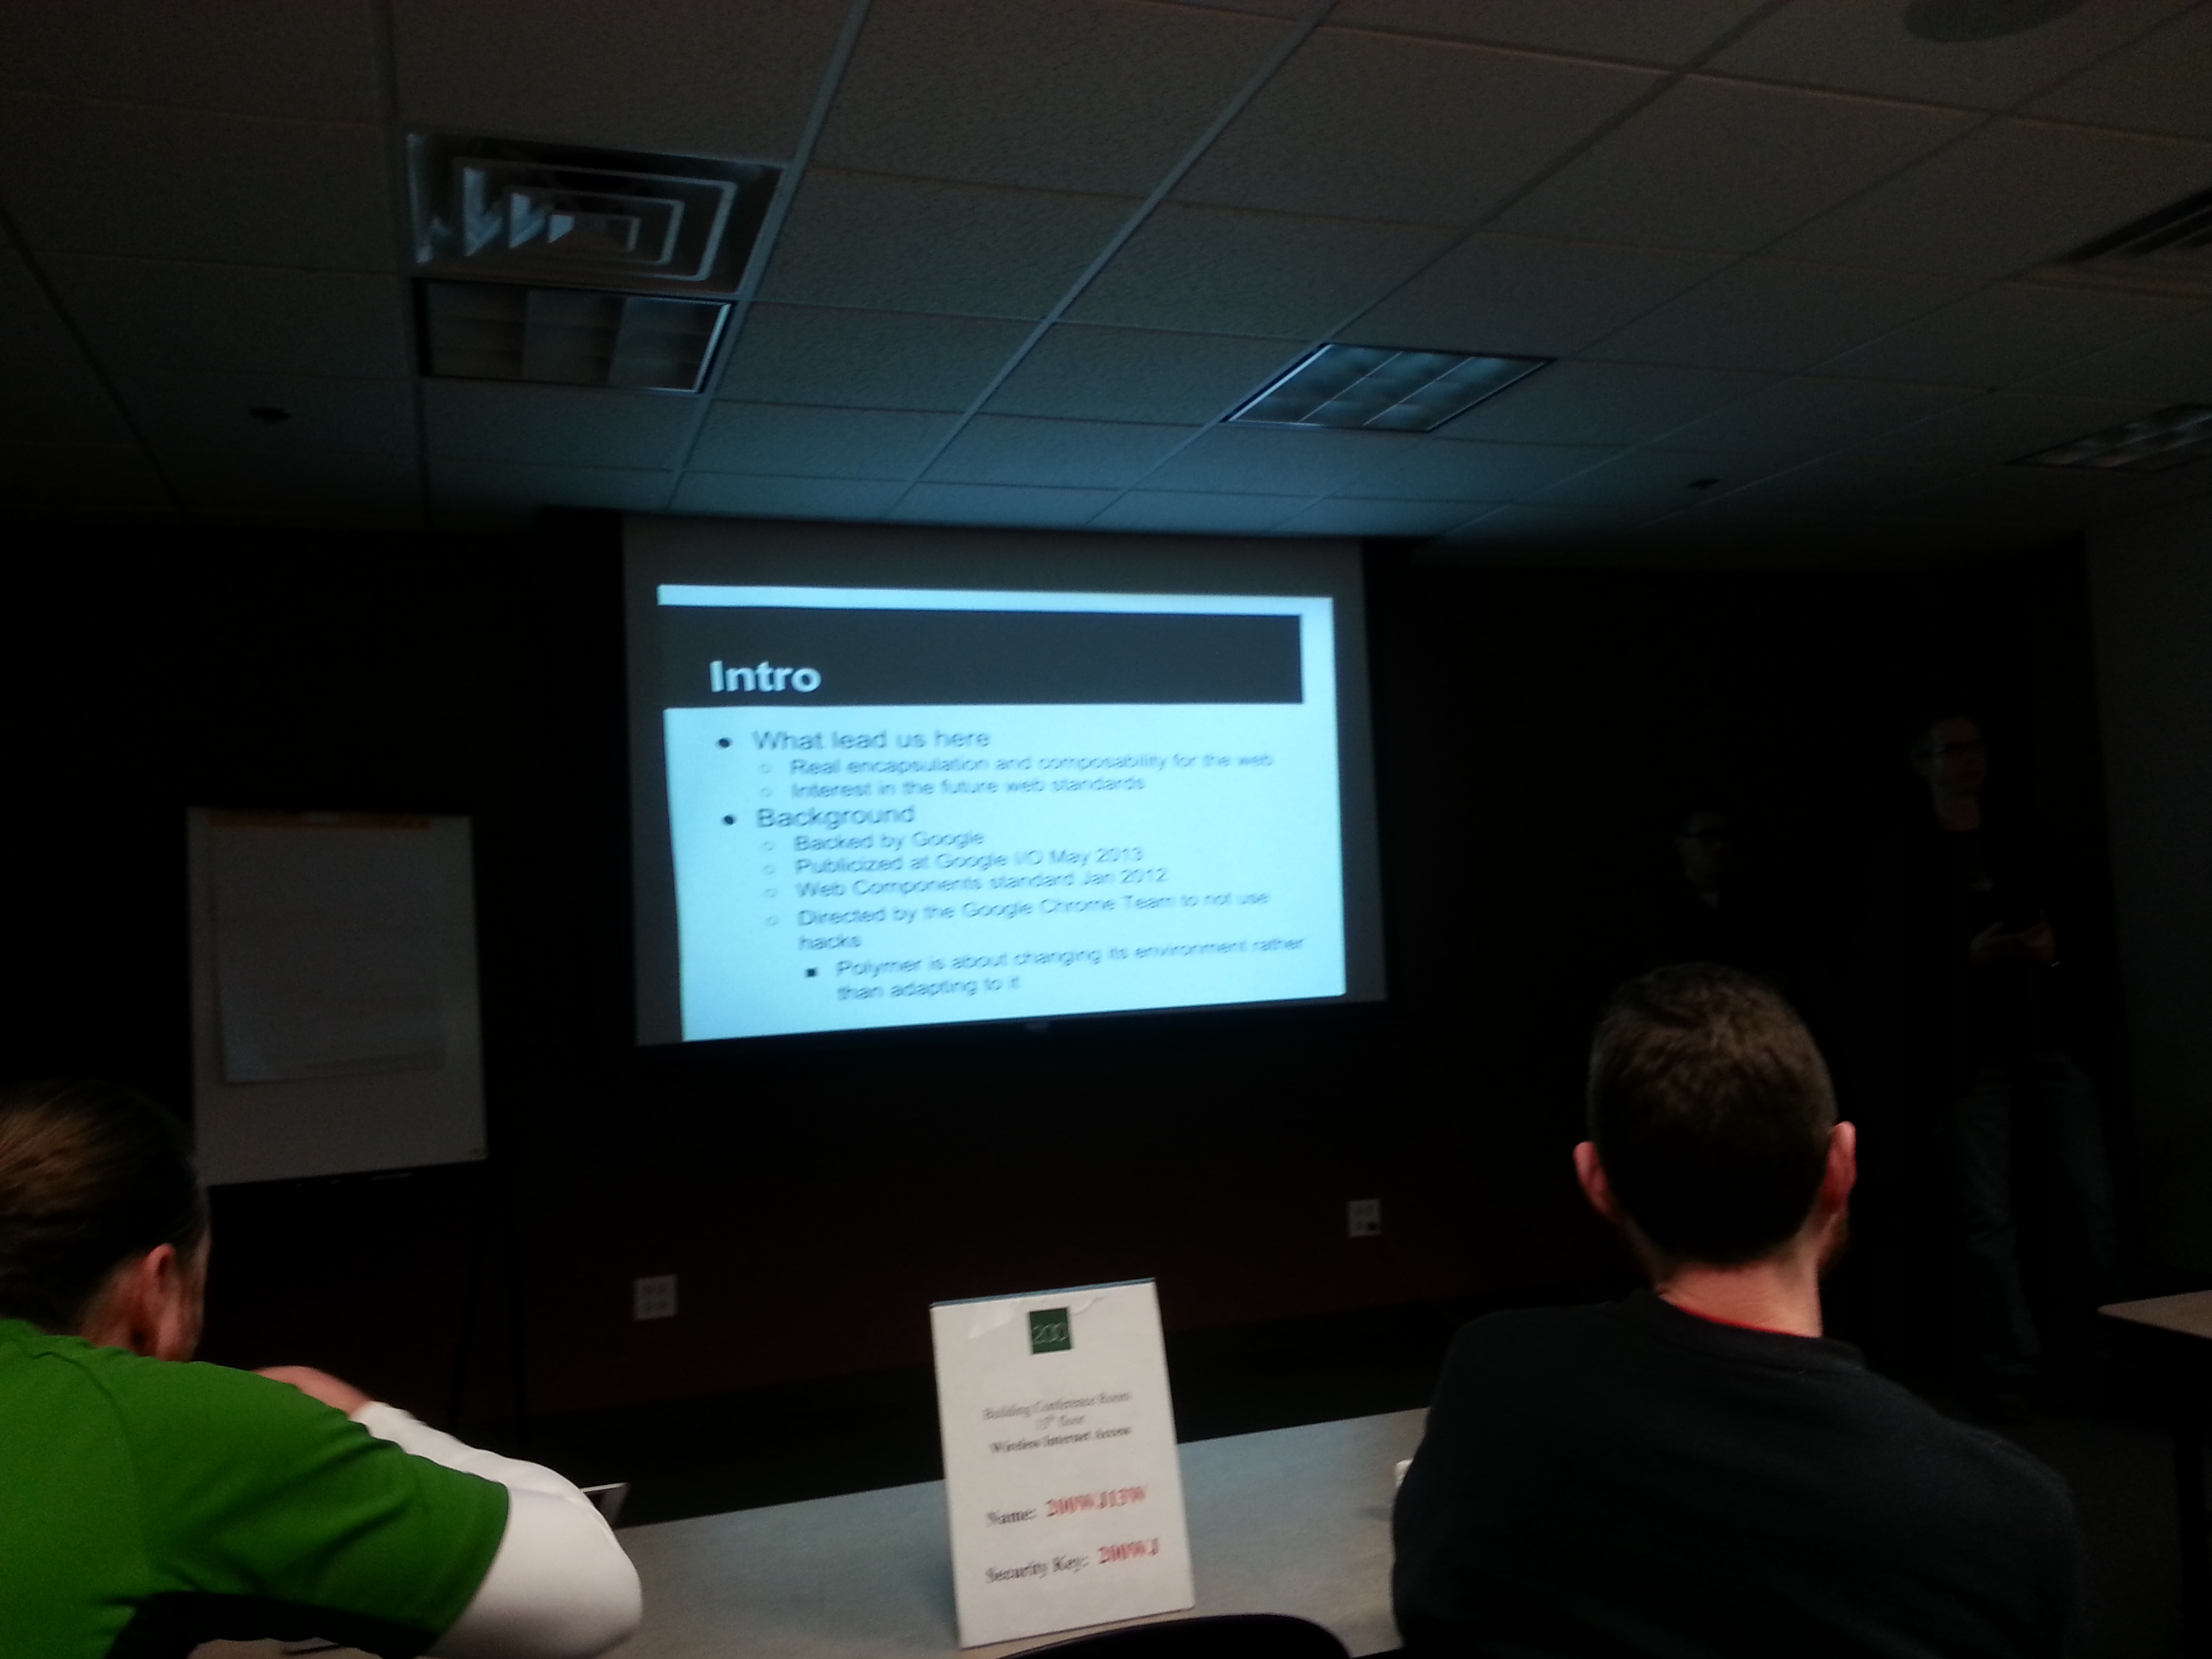
Opening presentation of Polymer.js, a JavaScript framework, in Chicago.
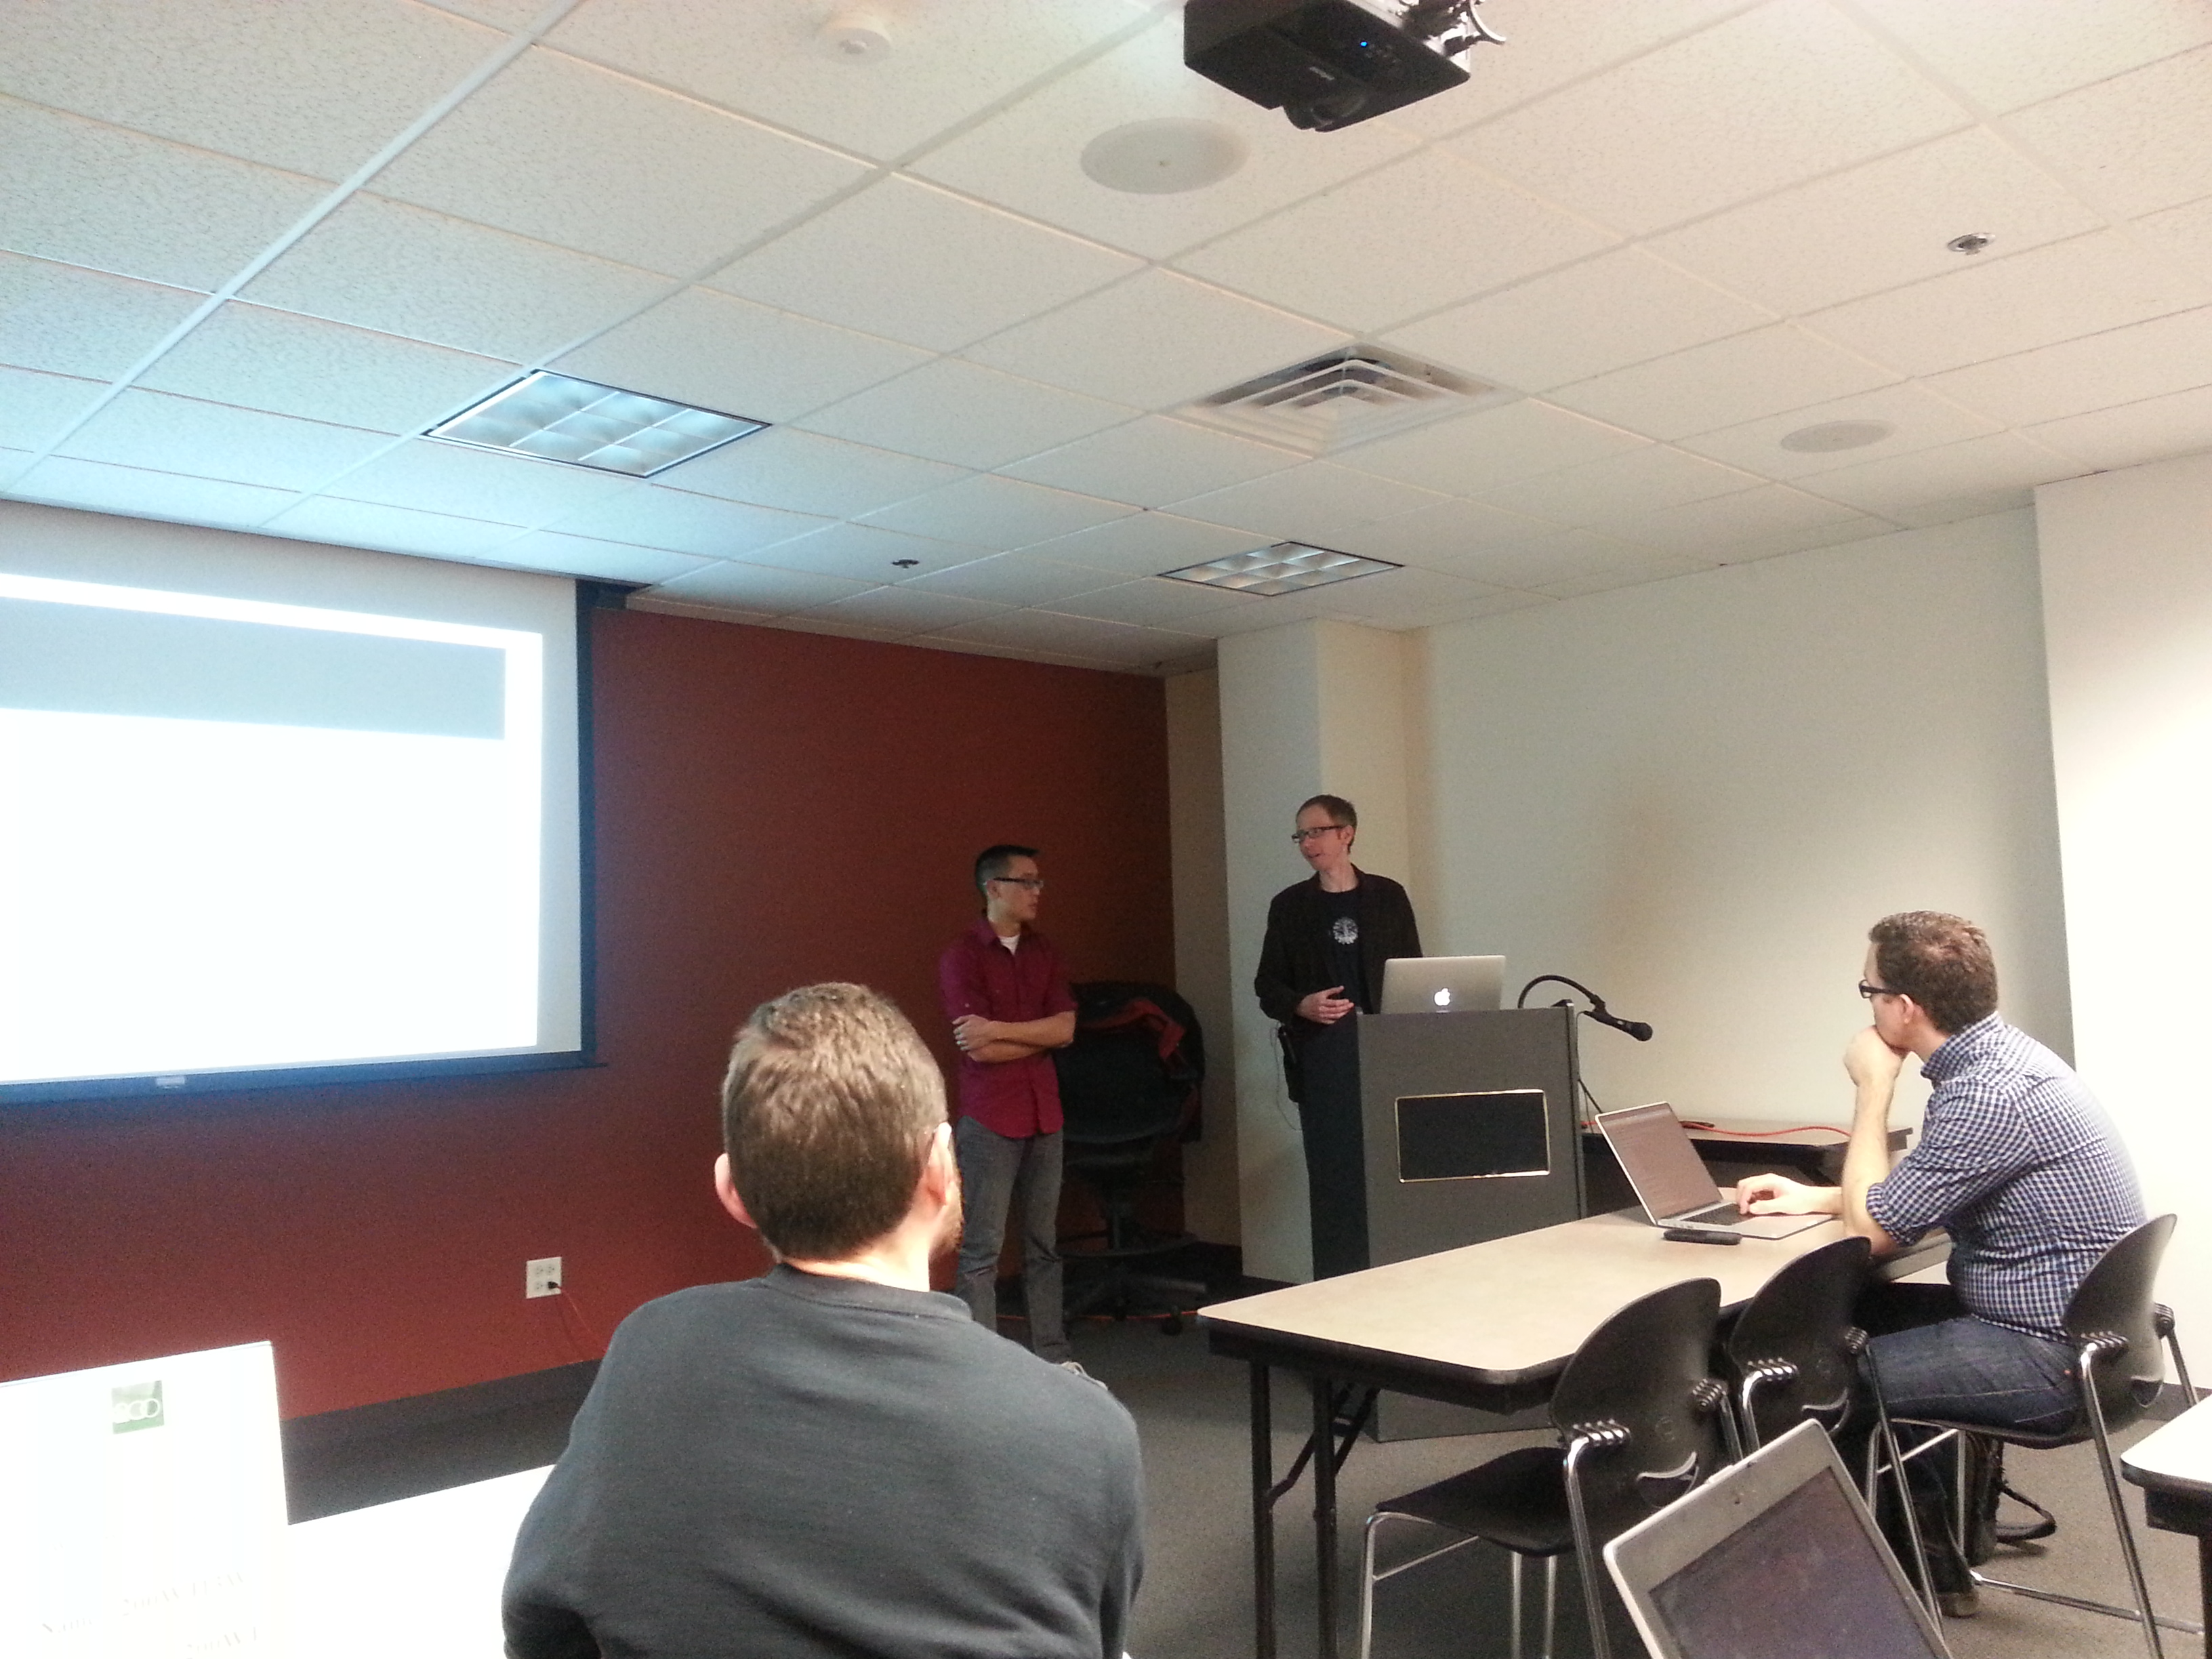
Peter Wong and Ryan Gerry present an overview of Polymer.js, a JavaScript library, at the Chicago Javascript Meetup in The Loop (Chicago)
"Web front end programming is a hostile environment" laments Ryan Gerry and Peter Wong, two developers who presented Polymer.js, a JavaScript framework, to the Chicago JavaScript Meetup group. The presentation, along with refreshments and presentation space, was hosted at Enova International in Chicago in November.
Polymer.js is one of several JavaScript libraries that have been rapidly introduced to the open source world. These frameworks are miles head of JavaScript's early days as "that language used for pop-up windows." The language is now at the forefront for unified communications and data visualization.
Polymer.js differentiates itself from existing Javascript frameworks by implementing the emerging Web Components standard. The benefit is a forward looking focus on evolving web standards to ease working with the DOM (Document Object Model) compared to backward compatibility.
The aspect I paid particular attention to Polymer's flexibility on HTML naming convention. The value of Polymer.js is that it attempts to organize encapsulation in a simple manner. Encapsulation in JavasSript means assigning a label that can be used globally in a document, such as the follow light-structured example.
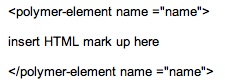
The <polymer-element name...> can be specified in variety of ways - The site Polymer-project.org hosts a demo on a few elements to show how more examples work.
Polymer.js elements differ from HTML elements like <div>, <p>, and <a>. HTML elements are meant to render text or an image in HTML documents - the items you see in a blog, web app, or website. Instead the polymer elements help to label and organize functional activities on a page, like calling data from an application in a JSON format. The ultimate value is reducing the number of JavaScript calls that can "bloat" a HTML page of code - Polymer.js simplifies code functionality at the browser.
Both Peter Wong and Ryan Gerry programmers have had an extensive developer backgrounds. In fact Wong and Gerry have worked together at Follett Software Company and currently work together at Centro. Wong has worked on WebSphere App Server class loaders and VR training for John Deere welders. Gerry is a founding member of Software Craftsmanship McHenry County and has been programming on the web since the late over two decades. He understands Perl, Java, Ruby and JavaScript.
Polymer.js is still in its early stages of development, but many developers are jumping onboard to learn how to extract value from the library and develop more valuable client-side applications.
You can learn more about the Polymer.js open source project here (Polymer-project.org). Examples are available, as well as a Google developer video that explains Polymer.js in full detail. Wong and Gerry's presentation for the Chicago JavaScript Meetup group can be seen here.
KPI are metrics that represent your company performance. The business benefit of KPIs is creating a means to measure how well your business is meeting its operational objectives. KPI usually takes the form of a ratio, though it can be either a count or ratio.
The post "4 Good Questions For Selecting KPIs for Your Business" lists a few key questions to ask in selecting a KPI. But no matter what, KPIs have two particular qualities meant to create meaning across all parts of an organization. Those qualities help KPIs provide a context to business performance that managers consider important. The two qualities are that…
Here are a few examples that can be found in a standard analytics tool:
For other KPI ideas, look at suggestions on dashboard sites in the Zimana post "Dashboard Resources for Analytic Best Practices: 4 for the hip pocket" as well as "4 Good Questions for Selecting KPIs for Your Business". And for more about social media influence on KPIs, read the Zimana post "When KPIs Socialize".
KPI is an acronym for Key Performance Indicator. KPIs are metrics that represent your company performance. The business benefit of KPIs is creating a means to measure how well your business is meeting its operational objectives. What KPIs measures defines how well a business is running.
To select KPIs for your organization consider the following questions to guide your selection process.
Sometimes other influences can play into a KPI. To see how social media can be a factor, read the post "When KPIs Socialize".
Ok, so you’re a small business, posting furiously on Facebook, thinking that you have achieved a great fanpage, but wondering why it is not leading to better engagement or even sales.
It all boils down to four letters: PTAT
PTAT stands for People Talking About This. Launched as part of a 2011 update to Facebook Insights, PTAT was a Facebook engagement metric that reflects the number of people who have a created a story based on your fanpage post.
The metric’s existence is part of a larger view regarding crafting messages for friends of fans instead of fans. Doing so is more valuable. Encouraging more people to share and create stories based on your post increases the exposure of the message. Plus people respond to word of mouth, which is what PTAT represented digitally.
PTAT has since been removed as a Facebook Insights metric. Reporting on Likes, Shares, and Comments are conducted separately, as well as an additional report to show where your likes come from.
In addition to the visitor action, time decay is a factor. The decay - how recent the post is relative to the measured period - is part of a Facebook ranking algorhthm metric, once called Edgerank. Edgerank is meant to weight various Facebook activity such as a like or comment. The metric also scores on the relationship of the Facebook user to the administrator, and considers the time since post first appeared.
PTAT and Edgerank may be gone and renamed, but they are why posting a series of messages the same way as Twitter is not as effective. Too many messages can give fans a stream of notes with no focus on the message.
With all the above said, here are some tips for increasing Fanpage activity with less posting frequency and more emphasis on the message.
This video examines an article on the fear of data visualization. Some manager struggle with hoe visualization is deployed. Watch and comment at the All Analytics site, All Analytics YouTube channel, or here at the Zimana blog site.