Many businesses are catching onto the value of content marketing through using their blog. However, one challenge that enviably appears is how to manage the posts once a schedule is established.
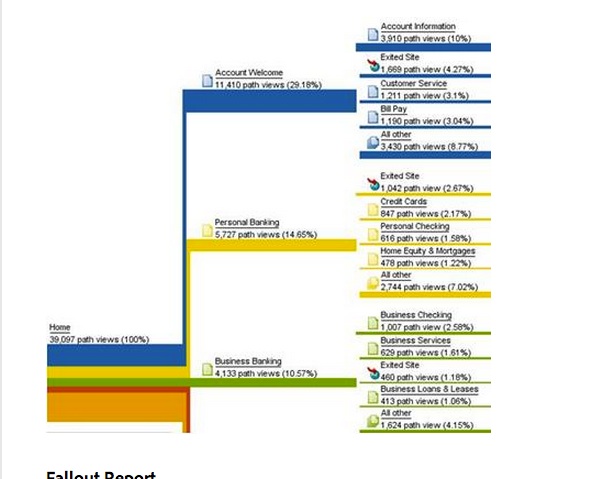
One analytics report that can be useful is visitor flow. This report is usually seen in Google Analytics, but all analytic solutions have this kind of report with some variation on the reporting capability. For example, Adobe Analytics has similar reports such as next page flow which notes which next pages visitors navigate from a selected page. This is part of a patching analysis reporting within the Adobe suite, which is essentially similar to visitor flow within Google.
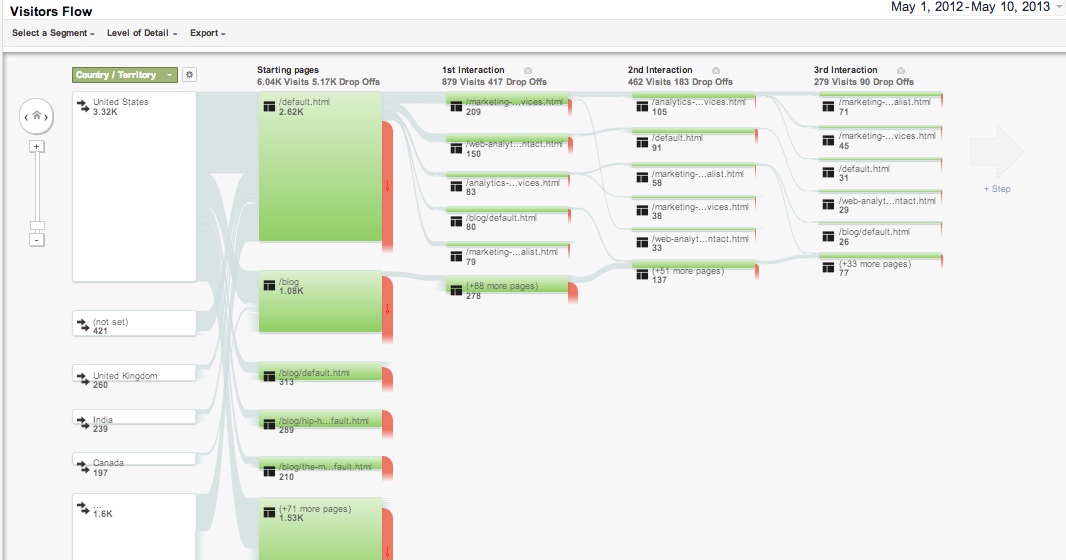
Visitor Flow reports, like this one in Google Analytics, indicate how people navigation among content
Use visitor flow reporting as a starting point for understanding where visitors are navigating on your blog. This report can highlight blog traffic sources as well as how well visitors are reaching other content. Use this to get a sense of the site audience.
First, highlight each of the top 10 referral sources by number of visits. You can extend the list to 20 if you need to view other sources that did not make the top 10 listing. Review the sites associated with the referral. This overview can give a sense of traffic quality coming to the site.
Next consider the time being spent from the referral traffic. Are there any referring sources on which people are spending above the average time on site? This implies that people are reading and that the referral source is sending engaged visitors.
Reviewing the site against the pages on which visitors land may spark ideas for what other content to provide.
This kind of analysis covers only one way to increase blog readership. Check out a few tips here to build your readership - combining these tips can enhance the analysis and build a meaningful way to connect to your audience.
Here are some other tips for increasing readership on a blog:
Jay Baer (@JayBaer) in a recent issue of Chief Content Officer magazine made a terrific metrics explanation with respect to content marketing. He outlines four useful metrics to enhance a campaign. Here's his comment:
"There are four types of content marketing metrics: consumption, sharing, leads, and sales. Most marketers overvalue the first two (blog page views and retweets, for example) and undervalue the last two (email subscriptions from people who first read the blog and, ultimately, sales from among that group). If you focus your metrics on behavior, rather than on data aggregation, you’ll be measuring points of greater business value."
Baer offers his overview of the four metrics here.
Baer's points drives the users to consider ideas beyond "applause metrics". Applause metrics are just like "hits" to a site - just reporting tweets or likes is not that same as reporting metrics that are associated with sales. Even in more simple terms, reporting tweets and likes must tie to strategic purpose to be valuable.
So, let's take Baer's points and outline a few starting metrics that can be used to measure how well your business is deploying content marketing.
Grow Influence is usually reflected in metrics that support visitor activity or consumption. For content that can mean:
Build Awareness occurs through sharing on social media. This means comparing the number of shares across networks and site activity that is driven by the traffic. Different analytic solutions offer different reporting solutions. Google Analytics records interaction through its social hub and social reports while Adobe offers a specific application called Adobe Social to measure social media behavior.
Drive Leads and Sales Let's combine these two points for convenience; the business objective is to gain conversions of leads into sales. So be it B2B or online commerce businesses, website conversions reflect online activity. Conversions are the percentage of visits that create a sale or a registration for a sales call. Thus consider percentages of site activity that produces leads or sales. This may require some detailed planning of content and tags that support an analytic solution. But the end result should connect metrics to the media used in marketing the content.
There are also more ways to refine reporting. Reports that cover multichannel sources and visitors flow through a website can further show what influenced visitors the most in making a conversion. Segmentation can permit a comparison of the intended site audience against the traffic quality being achieved from the content marketing strategy.
What metrics do you see for your content strategy? Share your thoughts below.
For another overview, check out the Zimana post: "What Are Good Basic Marketing Objectives for paid search, social media, and content marketing"
Likes, Pluses, and Retweets.
These social media metrics are a standard in the major programs, such as Twitter, Google Plus and Facebook. But these can also hinder analytic capability when businesses over focus on them.
It is easy to brag about how many retweets your blog posts receives or how many people begin to follow you. Volume Metrics = Ego Metrics = Vanity Metrics.
But simple volume numbers do not connect meaningful online activity to your business objective. The best experts who run blogs and media sites are concerned about segments of traffic, how well their posts are being exposed to their audience. Think of it another way; You want analysis that reflects closely to your intended audience or site goals.
So seek to develop measurement rates that permit useful comparisons that can guide your social media usage meaningfully. The comparison can be a rate or from an intended audience for a product or services. For example:
Web analytic tools such as Google Analytics, Adobe Analytics, and Piwik can provide a number of reporting options that can be arranged to enhance your business objectives. The end result should be a dashboard that helps indicate more than volume metrics.
In short, treat your metrics like a KPI when plausible. For learning about how to select a KPI, take a look at this Zimana blogpost for KPI starter ideas.
Concerned about keeping your analytics-derrived strategy safe? When planning security for said strategy, a description of your security plan should include one of the following words: Chrome, Firefox, or Internet Explorer.
Using an update web browser can be one of the first lines of defense against a cyber-attack. Phishing attempts are learning how to attack data entry points onto the cloud - that ultimately means methods for attacking a web browser.
One attack technique is cross site scripting. Cross site scripting occurs when phishing code replaces bits of intended client-side code that instruct browsers how to render and send webpage elements. The end result is that site users input data thinking that the data is being sent to a trusted site, but in fact the data is being sent to the phishing site.
Cross site scripting used to be an arcane attack method, meant to manipulate Javascript code and insert phishing sites unsuspiciously. But with more applications and websites deploying data visualization to the cloud - with visualization from Javascript-based libraries - Javascript has become more valuable - and cross site scripting has become less arcane as a result.
Here are a few preventative tips to keep in mind, not only for reviewing analytic data in a browser but for client-side applications, particularly when data input is involved.

Best Buy purchased mindSHIFT back in 2011 - it has since sold the IT services firm to concentrate on its retail stores.
With its $167 million acquisition of mindSHIFT Technologies back in November 2011, Best Buy's entry into small business IT demonstrated how technology (and a nice amount of available capital) permits new market entrants in surprising ways.
The news at that time certainly reminded me of how far Best Buy has come from its creation in 1983. Best Buy once excelled in enticing shoppers to stay in its stores. It became the largest retailer in 2009, and outlasted many competitors, including the now-defunct Circuit City. I remember going to Best Buy in my college days purchasing new release CDs for $10. Best Buy offered the CD sales as a draw for people to also browse its appliances and electronics.
But over time Best Buy gained competition against other retailers that rely on cloud services as much as retail – namely Amazon. Venture Beat once noted that BestBuy has become a “showroom” for Amazon – Best Buy “shoppers” who would purchase online after viewing a product in a Best Buy store. Best Buy has since launch a number of initiatives to fight the showrooming phenomenon, such as offering in-store pick up and expanding technical services such as Geek Squad.
Unlike online retailers, Best Buy has a physical presence, which appeals to shoppers who need to see and feel a product to make a purchase decision. But adding Geek Squad created an understandable reason for shoppers to return for more services, particularly as compact discs were no longer an effective draw.
Many analysts considered Best Buy’s entry into cloud IT services through mindSHIFT intriguing, given the consumer devices IT departments must manage. Who would most be impacted from the mindSHIFT acquisition, small businesses or corporate retail competitors?
The market entry was particularly notable for a small business market of former corporate professionals transitioning into entrepreneurship on the go, adopting mobile devices and working from home. Best Buy’s retail offering, such as Apple computers, placed it in a great potential to be a one-stop shop for small business tech needs. Furthermore mindSHIFT would have provided an interim step for small businesses that must grow their IT along with their capabilities to collaborate with others.
But to some degree Best Buy was pitted against small business IT providers. Small business IT providers who have served other small businesses cannot compete with Best Buy’s Wal-Mart like scale through mindSHIFT. Corporations complimenting small businesses and then competing with them are not new and certainly not restricted to the internet. If you want further proof, consider Duane Reade, a Walgreens-owned New York City pharmacy chain that competes against neighborhood lunch spots as it augments health care products with lunch food and light groceries. I recall from my time in New York hearing about a new Duane Reade on Wall Street that introduced sushi and breakfast pantry products (read more about Duane Reade here).
Small business IT providers can compete through providing service quality to their customers. Furthermore, the increase usage of cloud services and partnership programs through vendors generally helps small business IT providers discover a competitive scale with the right partner.
Mergers come and go, but they do sound competition alarm bells for small business IT providers. The successful providers will always have to increase service quality and enact marketing to let customers know how their service provides value. Analytics and process management application will help these small businesses make the most efficient choices against vibrant, large competitors seeking the same holy grail of technology and service scale.

Mobile devices are super useful thanks to apps. For mobile app development, latency must be managed to continue the mobile convenience.
Let's take a quick look at a growing performance metric that may not be the first on your dashboard needs, but can be a needed metric for those managing the next great app. That metric is latency.
Latency is the measure of a time delay in a system. It's meant to measure packets switched within a given network. That may sound esoteric and cryptic, but latency has a value as an indicator of network capacity.
Latency is calculated as part of page speed, where it represents delay:
Speed performance = Bandwidth (bits/sec) X Latency (sec)
Latency usually occurs at a higher rate on a mobile device than on a desktop - an O'Reilly video regarding latency notes about 3-4 times difference between mobile and desktop on average.
Latency has been labelled as the new bottleneck for expanding the customer experience on mobile, because for an app or website elements, it can be a factor for loading delays. In layman terms, it means the lower limit of bandwidth capacity needed to move information from server to client - a value for those apps that share data frequently in their design (which is a fancy way of saying "most apps"!). So the larger the latency, the more possibility of delay.
So how is latency best measured? Latency can be measured within a web analytics solution. Google Analytics monitors latency as several metrics within its Page Speed reports using a combination of the Page Timing and User Timing reports. Google details how the reports work in regard to latency in this technical post.
But care should be taken into how the metrics are gathered. Google, for example, notes that it samples its page speed data. Such sampled metrics may not consistently represent how a webpage is rendered, so that can be a challenge in having an exact value. Page speed measurement tools can offer better accuracy (These are covered in this Zimana post). Consider also a packet sniffer such as Charles or Fiddler. These tools can simulate a call to a hosting server based on a limited amount of traffic. Such a call can reveal problems for mobile and tablet devices operating with a limited signal and indicate what can be done to improve app performance.