Web development professionals have long considered page load speed as a valuable performance metric meant to reflect a positive online experience for a website visitor. Today’s consumers have adopted that consideration – and so should your business.
Faster page load times will help ensure your fast-moving mobile customers are seeing a great offer instead of an annoyingly slow site, particularly when digital signage and mobile devices are involved.
Consumers increasingly use smartphones to complete personal tasks. For banking customers it means checking balances, reviewing transactions, or receive alerts while on the go. Retail customers may be looking to take advantage of free shipping. No matter the business type, customers expect sites and apps to load pages easily with a minimal of delay.
The banking industry offers a clear B2B example of the shift to mobile beyond just e-commerce and retail. According to a Forrester report on banking trends, US mobile banking adoption among consumers had grown rapidly, “more than doubling from 5% of online adults in 2007 to 12% in Q2 2010.” The report also had predicted that by 2015 one in five US adults will be using mobile banking.
Some nuances specific for financial service activity have indeed emerged. According to an Adobe Mobile Consumer Survey, mobile users indicated page load speed to be a priority. Among surveyed mobile users who use financial services, page navigation was the highest concern.
The activity highlights how essential yet subtle a role page load speed plays in campaign success. Marketers relying on mobile campaigns and digital signage must monitor page load as a performance indicator. The quality of page speed performance will eliminate a weakness if signage media or a remarketing paid search is meant to encourage customers to use your app and ultimately its services.
A few tips can make sure that the right page quality is being experienced. While there can be technical reasons for a slowly recalled page, the tips can be considered outside of a skill set of an IT team.
These tips focus on managing the digital campaigns across a number of touchpoints. Ultimately managing page load speed can be a great lead to closely knowing how on-the-go customers experience your services.
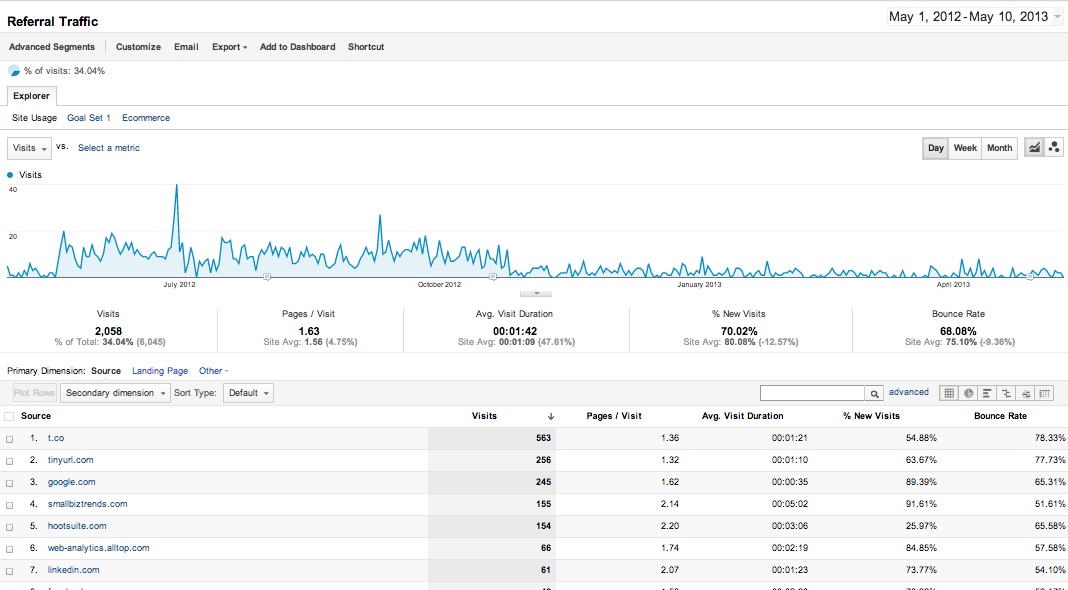
Referral traffic reports can reveal which sites are sending traffic consistently. But checking out those sites can give you more than just the numbers.
Debugging Javascript is a task that developers find themselves doing more frequently these days. The scope of Javascript usage continues to be widely adopted in various frameworks such as MeteorJS and AngularJS. Thus developing debugging skills is becoming valuable, even for analytics practitioners. There have been many analytic practitioners who have also a developer background. But with more complexity online due to the advent of apps and expanded web presence (launching desktop and mobile websites), developer perspectives become a highlight in the task level.
This presentation was given in Chicago at the Chicago Javascript meetup at the office of Nova. MD Khan demonstrates how the developer console can be used. He does a terrific job outlining how a few parameter tips that can make debugging easy. For example, he notes how adding a label in the parameter for console.log can help identify a variable that is returned.
Learn more by watching this video, recorded back in November 2014. You can check out the presentation slide here. Also, look for MD at his Twitter handle @mdkhan005 and his site thatJSdude.com for more tips and ideas.
The drive for businesses to better understand customers through data has never been higher. This infographic from Alteryx explains the influences on customer behavior prediction. Read on.
The diagnostics for analytics can take many forms, but the challenge lies in where to start troubleshooting first. One approach is to simplify the source of the problem - errors can lie either in the data collection or in the report settings of your analytics solution. Let's look at a few typical occurrences.
Addressing data collection issues first is usually a good place to start. They are symptomatic of technical issues with an analytics code installation. These technical issues usually appear as sudden changes of data trends in analytics reports - Spikes or steep drops - or implemented changes in tag details, such as mistyped regular expressions.
First, eliminate the basic analytics installation concerns. Verify that the site pages contain the latest supported version of the web analytics solutions being used. If a site has not been updated in a while, it can be easy to have features or settings that are no longer useful in place. And analytics providers sunset features, so for the latest information, follow a well-supported resource from the solution provider.
Next, troubleshoot to confirm that the analytics page tag is installed correctly. Manually you can always look at the source code of a webpage just to to see if its there. No code means no data regarding the page is being reported in the analytics solution. Developers typically add the main analytics code at the top or bottom of a webpage.
A manual search of a page for an analytics is acceptable for simple sites with a page or two; For sites with a large number of pages, a few tools are available to make verification easier. One easy tool is the notification alert. Located in the upper right of the screen, the notification alert reflects what should be corrected in the settings (You can learn more about each indicator here in this Zimana post)
Given the steady onrush of JavaScript, coupled with design configurations that increasingly account for mobile, a bevy of debuggers are available to manager issues related to code. Among the most popular is WASP, a debugger created by Stephane Hamel of Cardinal Path, is an example, considwred the gold standard for checkers. It was launched on 2006 and has steadily been refined over the years; a WASP Chrome plugin is now available.
There is also Tag Assistant, a Google Chrome plugin which works with Google Tag manager and other enterprise-level tagging as well as Google Analytics.
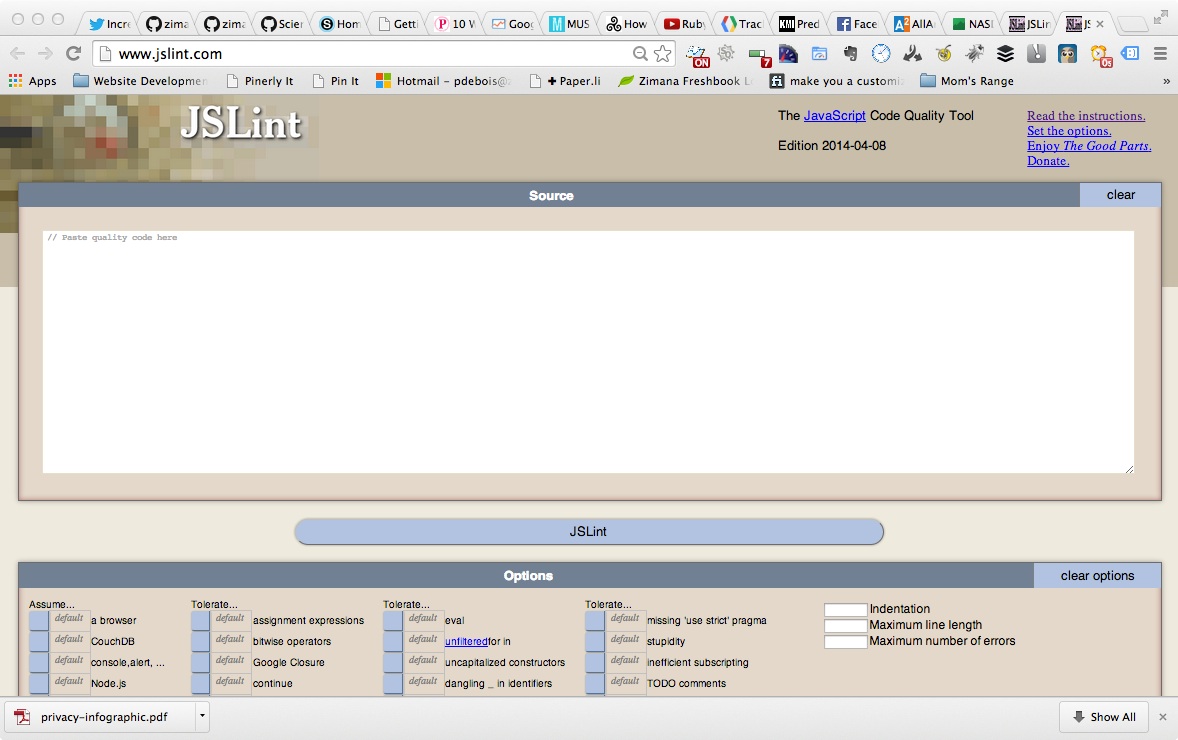
You can also use a web development JavaScript checker like JSLint to check if there is an interference with another JavaScript code being called on an inspected page. This requires pasting the code into the checker.
Other tools that can help for issues regarding tags and cookies include Firebug (which works mainly with Firefox; Firebug Lite, a version for Google Chrome, is available) and Google Chrome DevTool. These can focus on potential issues that impact how the website code is being interpreted in the browser.
Tools are helpful for verifying how tags and fired when webpages are rendered. Packet sniffers come in handy for webpage render inspections, revealing, for example, where bots crawled without executing a Javascript call. Fiddler and Charles are the best known packet sniffers. In general if the data volume seems lowers than usual, inspect any design changes that impact data collection.
You can also record how data is being collected - Fiddler and Charles have recording features, which show a number of server calls for site elements when a webpage is rendered during a session.
Having a review of what tags have been added to a site can help highlight what tags should be in place at a website’s launch, and what has impacted the collected data from a site.
Some errors are associated to misinformation in the report settings. The result for analytic users is viewing trends that do not make intuitive sense. The errors are usually consistent - examining over different time periods or reviewing dimensions can reveal hints about what may be going on.
1. View if data is appearing in the report
Use real time features for quick confirm basic functionality for receiving data. Most analytics reports takes up to 24 hours to display results online, but many sub features can be available within a few hours depending on site visit volume.
2. Note misalignment of goals
Know how your site elements are related to conversion goals. It’s the core for what should be provided – apps. information, and the social media that compliments it.
3. Review environment in which reporting is issued.
This connects to number 2 - review what conditions are being created. Is there a period in which a spike occurred? What marketing occurred? Most of the details may not tell you why a spike happened, but you can better focus on how to deploy some possible next steps to correct the problem
4. Examine the syntax of filters to make sure they are functioning.
Filters sort our data that is reported through the use of regular expressions - text characters that filter characters in a sequence. These are tricky because it takes an imagination of the text pattern being filtered. Planning for regular expressions means accounting for ongoing anomalies. Thus user error or a sequence overlook can occur.
There are a few tools available for verifying the validity of regular expressions - RegExpal is an open source checker, though you may have to check if the platform is supported.
Also this is a good reminder to keep an untouched profile. For example, Google suggest maintaining an unfiltered analytics profile alongside one that contains filtered. Doing so permits quick identification of data anomalies and discrepancies.
5. Journal any changes made by admins
Mark each update or setting change with Google Annotation. Doing so can help everyone understand the history of what was added to a website or if a setting was changed. This can eliminate choices that have been tried before, and maintain focus on what can be corrected.
6. Note data changes greater than 10% as a starting point for diagnostics
This is more of a judgment call, but swings in data more than 10% can indicate a problem in data collection or a difference in a trend. This guide can help zero in on areas in which questions can be asked and action taken. Results in E-commerce and Adwords reports, for example, usually are based on traffic that clicked tagged URLs - like a paid search ad URL or a landing page for a commerce offer. Because these clicks rely on multiple tags or a complex site structure, like a subdirectory, click losses greater than 10% can be indicative of a tag firing concern.
7. Conduct periodic team review of report status and concerns
The best diagnostics step in maintaining the report settings is plan an occasional review with the team together and see how the reporting is used. This breaks silos - imaginary limitations of personal knowledge of what is occurring on a website. The end result is the right result, getting team members to communicate.

Most businesses have heard the definition of analytics at some point since 2006 (with Zimana being in business since 2009). Here is the definition, for those just joining the internet. Analytics is about the measurement of a system. With respect to small businesses, the interest is in web analytics. Web analytics is the measurement of website performance.
The origins of web analytics is linked with web development. Originally it was meant to track and help account for webpages being served – in essence, a diagnostic tool. But with the advent of paid search, combined with newly introduced Javascript tags, marketers realized that web analytics could provide a means to manage marketing campaigns, thus raising results and reducing costs.
The next advancement of importance are smartphones and tablets. They changed the ways people review websites before making a purchase, because sites are accessed while visitors on the go instead of just at home. Moreover, websites are increasingly accessed by mobile devices, so the sites have to be mobile-friendly.
If you are starting your business, there are a few ways to start using analytics to confirm how your website enhances your business digital strategy. Planning for data collection can become complex based on the amount of marketing you have planned, but a dedicated planning pays off in organizing necessary steps, reducing effort needed over time.
If you are unsure where to start, here are a few great starting points if you are just planning to launching a website.
In this example, three words can be selected to the subdomain, kept relatively short in case a customer is typing the URL or speaking the words into a search window on a smartphone. Each word can be an opportunity to use a keyword - say "shoe repair" in this instance - or a useful high volume description like "Chicago" to help in local search.
There's no one combination that will guarantee success, but the key is develop the most descriptive page names that will aid discovery in a general search engine.